Higher and foundation tiers
Surface area has a big effect on the rate of a chemical reaction as an example consider the reaction of a metal such as magnesium
with an acid. A strip of magnesium will fizz quickly in an acid but if magnesium powder is placed in the same test tube of acid a very violent reaction will take place. The powder will react many many times faster than a strip of magnesium ribbon. This is due to the
way the atoms are arranged in the solid strip of magnesium or indeed any solid and how the atoms are arranged in a powder. This is outlined in the image below:
NOTE: breaking a solid into smaller and smaller pieces increases the surface area available to react.

The surface area is as the name suggests simply how many of the atoms are exposed at the surface of the solid. In the diagram above most of the atoms in the solid are not exposed at the surface, they are buried or are underneath other atoms within the solid structure. In order for the atoms in a solid to react they will have to collide with the particles present in the other reactants, however this will NOT be possible for the atoms buried deep within the solid structure.
However if a solid is crushed or broken up into a powder then it is possible for nearly all the atoms to collide with other reactant particles and so have the potential to react and form new substances. This is outlined in the image below:

In the image above the green atoms can only react with the brown atoms on the surface of the solid- they cannot collide and react with the brown atoms deep within the solid structure. However if solid is crushed then it is possible for the green atoms and the brown atoms to mix freely; collide and possibly react successfully with each other. The powder on the other hand has a much larger surface area in contact with the green atoms; as shown in the image above. The more a solid is broken up into smaller and smaller pieces the more we can increase its surface area.
Consider the reaction between marble chips (calcium carbonate) and hydrochloric acid. Equations for this reaction are shown below:

 Since the reaction of marble chips and hydrochloric acid releases carbon dioxide gas; which is a heavy gas; it will be possible to measure the rate of this reaction by recording the loss in mass say every 15 seconds as the reaction is occurring. The faster the reaction the more carbon dioxide gas will be released and the greater the loss in mass from the conical flask as the gas escapes into the air. If a student were to draw a graph of the results from this experiment what do you think it would show?
The graph opposite shows a typical set of results. The gradient or slope of the line will indicate the loss in mass; the steeper the line the more mass is lost or the more carbon dioxide gas is lost and the faster the reaction taking place. You can see that the small marble chips react faster than the marble chip "lumps". If we were to grind up the lumps into a fine powder and react
it in a third conical flask then where do you think the line would appear on the graph?
The steeper the line the more gas is given off in a given time; that is the loss is mass is greatest and the rate of reaction will be fastest.
A shallow line on the graph will indicate a slow reaction, a steep line a fast reaction. So if a powder were to be used the slope of the line would be almost vertical and the reaction would likely be over very very quickly.
Since this reaction produces carbon dioxide gas you could of course measure the rate of reaction by measuring the volume of gas released in a given time. The more gas that is released in a given time the faster is the reaction taking place. You would need to have at least five different consistencies of marble chips; ranging from large lumps to a fine powder. If an equal mass of each of the five different consistencies of marble chips were added to the same volume hydrochloric acid with a concentration of 0.5M you could record the volume of carbon dioxide gas released every 10 seconds from the scale on the gas syringe; as shown below. Although I suspect that as the surface area of the marble chips increases the reaction may finish very quickly! Though you could slow down the reaction by reducing the concentration of the hydrochloric acid or by lowering its temperature. A possible set-up for this experiment is shown below although there are a number of ways of carrying out this experiment.

A typical set of results for this experiment is shown in the table below. Here the student recorded the volume of the carbon dioxide gas every 30 seconds.
| time/s | 0 | 30 | 60 | 90 | 120 | 150 | 180 | 210 | 240 |
|---|---|---|---|---|---|---|---|---|---|
| volume of gas/cm3 | 0 | 40 | 75 | 100 | 111 | 116 | 119 | 119 | 119 |
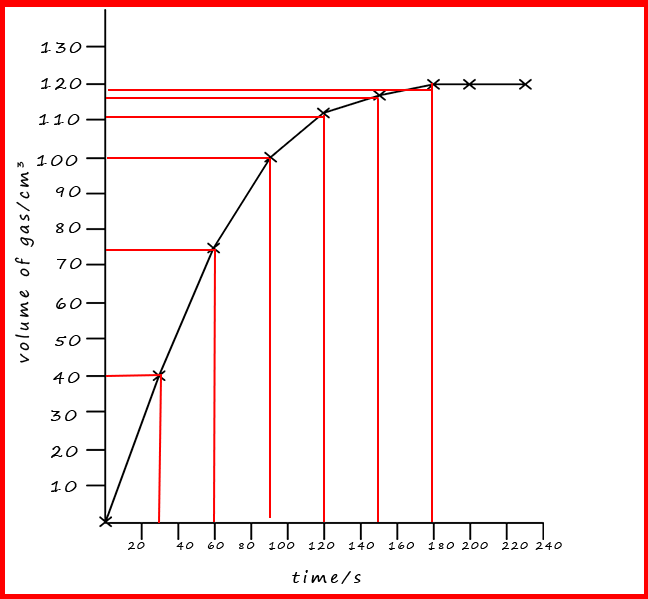 A graph of these results is shown opposite. There are a few points you should note from the graph:
